New Hampshire Old-Time Country Dance Web Site
Dancing in New Hampshire Now & In Earlier Times

Side Note: How I Figured Out about Global Warming So Long Ago
With Some Discussion of the Conflict Between the Roles of Empirical Evidence and Established Belief Systems
As I mentioned on the home page of the website, I figured out the existence of global warming in the early 1960s, before I even reached my teens. Here's the story of how I figured it out so long before most other people. As long as I'm on the topic, I include some discussion of how established belief systems (usually religioius but sometimes scientific) can interfere with perception of observation-based evidence, even when the evidence is very clear.
I mention in passing on the home page that I figured out about global warming in the early 1960s. That's long before most of the rest of the world figured it out — and sadly there are many people including much of our so-called leadership who apparently lack the observational skills and/or scientific background and understanding to have figured it out to this day. So how did I as a 10–12 year old figure out something that still eludes our president and most of his political party?
Well, it turns out that I was interested in the weather since childhood, and for several years in the early/mid 1960s I subscribed to a daily weather map published by the Weather Bureau. It was a large publication, at least a couple feet across, and was very detailed. Below is the weather map from the day of my 10th birthday. If you're at all familiar with weather maps you'll see that it's way more sophisticated than the best weather maps available today.
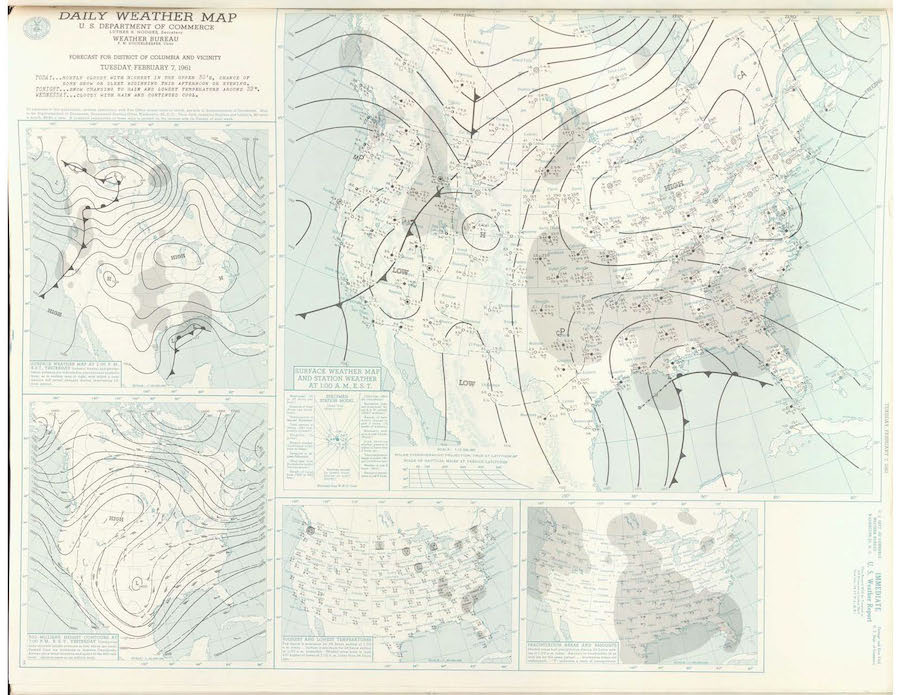
Here is the weather map from my tenth birthday, 2-7-1961. In addition to the detailed weather map it contained other information: upper air currents, high and low temperatures and precipitation amounts for many locations, and more.
They were fun and interesting in themselves, but in addition the Weather Bureau would present all kinds of interesting information on the back of the map several times each month. One time it would contain climate data for Washington DC going back to 1885. There would be a graph of the average high and low temperature for each month, and of the average of the daily mean (average) temperatures for the month.
Below is a graph of the average daily mean temperatures for the month of April from 1885 to 1960. I redid the graph from the original data to make it more legible; the original is drawn on graph paper and the lines of the graph paper are dark enough it doesn't reproduce very well. There are two straight lines drawn in. The solid line is the best-fit straight line through the data. For those who want to know, that means that the total difference between the points and the line is made as small as possible.
As you can see, the line clearly goes up across the time period. I drew in a second line (the dotted line) at an average temperature of 55.5°. If you look at the earlier years, between 1885 and 1907 there are two years where the average temperature was exactly 55.5°, but only one year (1896) when the average temperature was higher. On the other hand if you look at the later years, from 1945 on the average temperature was above 55.5° 13 out of 16 years. So the warmest months during the first 23 years were about equal to the coolest years during the last 16 years of that time period. Looking at the averages, from 1885 to 1907 the average April temperature was 53.1°, but by the years 1945 to 1960 the average April temperature was 57.0°, or 3.9° warmer than it had been.
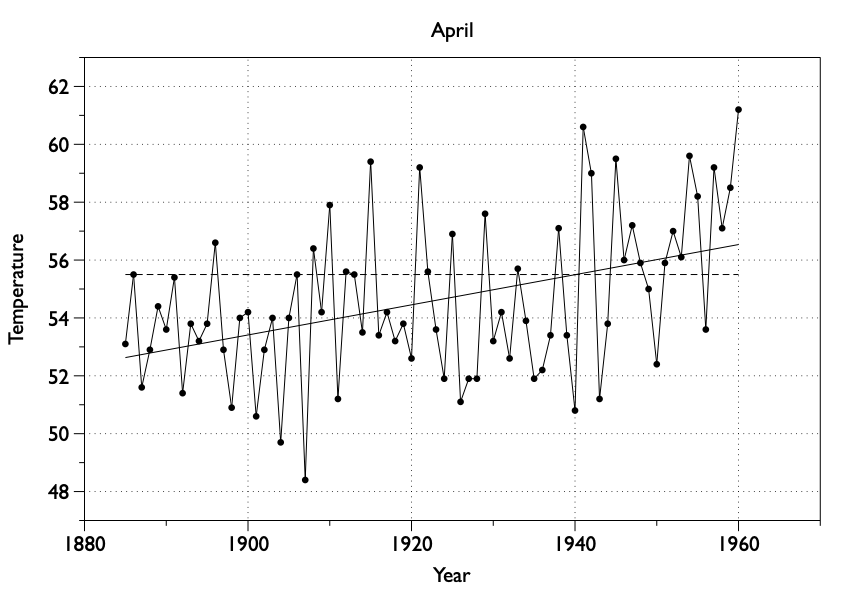
Average temperatures for the month of April from 1885 to 1960. The upward trend is hard to miss.
I was able to find data for every month of the year. Here is a graph of average monthly temperature for January, April, July and September for the period 1885 to 1960, with the best-fit straight line drawn through each set of data. (I used September rather than October to make the graph more readable; October is too similar to April.) As you can see, in each case the line indicates a gradual increase in average temperature over time. Overall the differences are greatest in the winter (an average increase of 3.7°, and smallest in the summer (an average increase of 2.0°).
As a 10–12 year old I looked at those data every month when a new graph appeared with great interest. The fact that the temperature was gradually increasing just jumped out at me as an unavoidable conclusion. Needless to say, I wasn't able to figure out the mechanism, but I had little doubt that the differences were real.
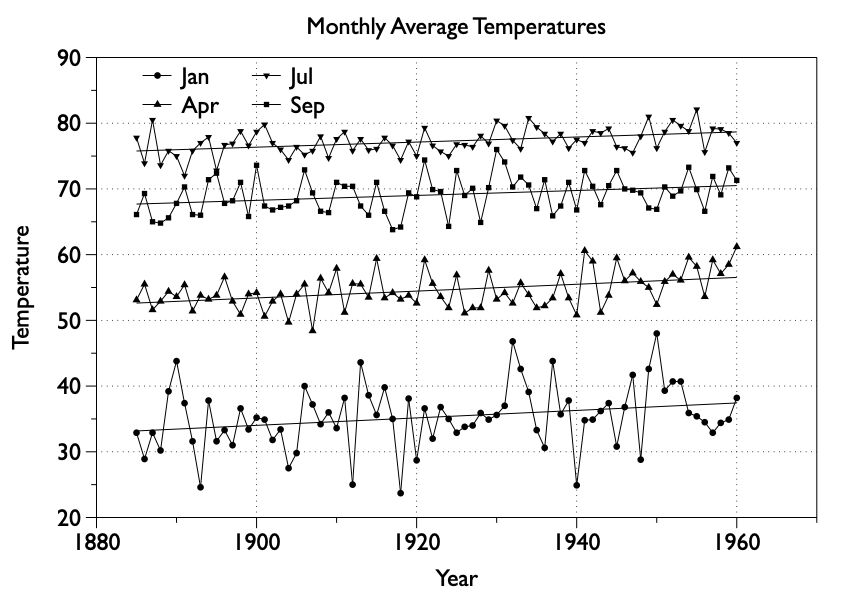
Monthly average temperatures in Washington D. C., 1885–1960. From the Daily Weather Map, published by the U. S. Weather Bureau.
The obvious question is why, if it was so obvious to me at such a young age, was it apparently beyond the comprehension of adults with far more education and scientific background than I had? The answer seems to be related to the power of deeply held beliefs over empirical observation (evidence based on direct observation and experimentation).
This is far from the first time humans have followed their established beliefs despite sometimes overwhelming evidence to the contrary. A classic example would be the discovery by Galileo of the four largest moons of Jupiter. In that time period the Catholic Church was a dominant force in terms of how people thought about things. Certainly attitudes and beliefs with respect to the planets and stars were very much framed in terms of their religious beliefs.
It was believed that the heavens were perfect and unchanging, and that the earth was the center of the universe. The planets and the stars and all other heavenly bodies were believed to revolve around the Earth. Furthermore, they were thought to be perfect and unchanging.

One of Galileo's early telescopes. Photo from a clip art source, to be used for noncommercial purposes without need for acknowledgement. If this is a copyright photo please contact me (see footer).
In 1609 Galileo invented the telescope, and started looking at the sky. He paid particular attention to the planets because, being closer, there's more to see with them. He saw that Venus has phases just like the moon. Then he looked at Jupiter, where he saw four objects near it. At first he assumed they were fixed (regular) stars. But over the next few days he observed Jupiter a number of times. Each time those four stars were there, but they were in different places. After a while it became apparent that these four objects were not fixed stars, but in fact were clearly revolving around Jupiter.
He also studied the Sun and found sunspots — dark spots that changed and over across the surface of the Sun. He also found that the Sun was rotating on its axis.
Galileo presented his findings in 1610 in a short book called Sidereus Nuncius — the Starry Messenger. The book had a major impact because it went against the nearly universal beliefs about the way the world, planets and stars worked. It must be said that some people were very excited about Galileo's findings. They acquired telescopes and started observing these things for themselves. His findings were very easily replicated by anyone with a telescope.
But many people were very upset at the challenges to their beliefs, taking them as a direct challenge to their religious beliefs The idea of something revolving around Jupiter just didn't fit with these beliefs. Likewise the idea of sunspots that changed and moved across the surface of the Sun directly challenged the belief in the perfection and unchanging nature of the heavens. There were additional findings mentioned in the book which provided similar challenges.
The responses to Galileo's findings were interesting. Many people simply refused to look into the telescope. Some people went so far as to say that the moons were creations of the telescope and weren’t really there. A prominent astronomer, Francesco Sizi, said of the moons of Jupiter (after a discussion of mystical patterns of sevens that were inconsistent with their existence) that they’re invisible and thus can have no influence on us. Therefore they’re useless. Therefore they don’t exist.
These may seem like strange arguments to most of us, but at the time they were considered to make perfect sense.
There are many similar examples. The evidence for evolution is overwhelming, but to this day people deny it for reasons having to do with religious beliefs that for many of those people are poorly formulated and easily overlooked when it's convenient to do so.
Continental drift was first proposed in 1596, but it was incompatible with church dogma so it didn't get very far. It was next proposed in 1912 by the German meteorologist Alfred Wegener. Besides the obvious fact that the continents appear to fit together, he presented evidence from the fossil records, geological features and more. But it was believed at the time by scientists that the continents and oceans were stable and permanent. So his ideas were contrary to the prevailing belief systems of Christianity, and also the prevailing belief systems of most scientists in the field. It wasn't until the late 1950s and 1960s that the ideas of plate tectonics came along, and provided a plausible mechanism for the continents to move. Finally the idea started to be accepted.
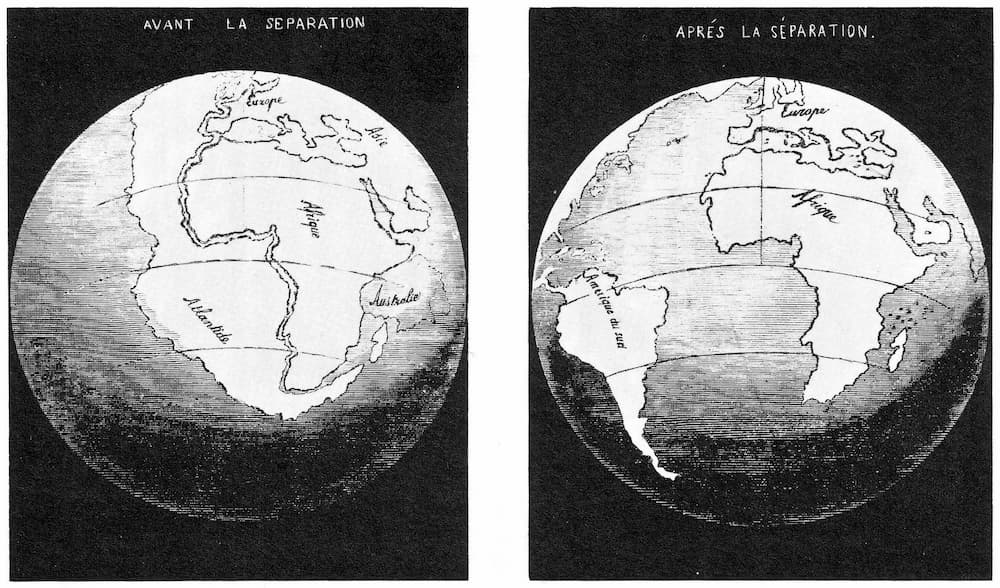
Antonio Snider-Pellegrini's Illustration of the closed and opened Atlantic Ocean (1858). This was one of the earlier illustrations to show how well lthe continents fit together. Wikimedia Commons, Public Domain.
Now back in the early 1960s I was quite familiar with the current accepted (and related) wisdom which said that climate changes at most very gradually across long geological periods. The idea of a noticeable change within a person's lifetime was considered absurd by most scientists, and for many people contrary to their religion. So as I expected, when I told adults what I had figured out, no one believed me except for my father. I learned how easy it is for people to deny something just because it doesn't fit their preconceptions, even when it was completely obvious from the data that they were wrong.
The idea of industrial byproducts being able to affect the climate was first proposed in the late 1800s. But it wasn't until well into the 1960s and the 1970s that the reality of climate change began to be accepted by scientists, and large portions of the general public have been remarkably slow to accept it.
I figured it out well ahead of that. But I don't claim any special wisdom or observational powers. I was fortunate enough to have been taught the importance of observation and critical thinking skills from a young age. But there must have been many people who observed the same data who had much better developed observational and critical thinking skills than I did at the time, and they just didn't get it.
I think a large part of it was that at my age, I didn't have the well-established beliefs that prevent many people from accepting even strong evidence, whereas most adults were stuck with beliefs based on scientific or religious frameworks that made it hard to accept such ideas. I have certainly made similar mistakes myself, although at this point I'm much more likely to notice what I'm doing. I should add that while I figured out that the climate seemed to be warming, I didn't figure out all the implications of this fact.
Needless to say the evidence is vastly more complete and vastly more obvious today. But yet there are many people who deny the reality of climate change. By now it's so obvious that I find this incomprehensible. But it appears that a substantial number of people live in an alternate reality in which belief based on political and religious dogma appears to be more important than the evidence of our senses and the evidence of systematic scientific observation. It strikes me as hugely ironic that something I figured out well over 50 years ago remains beyond the ability of so many people to understand!